Monitoring sensors in the Dagster UI
Using the UI, you can monitor and operate sensors. The UI provides multiple views that help with observing sensor evaluations, skip reasons, and errors.
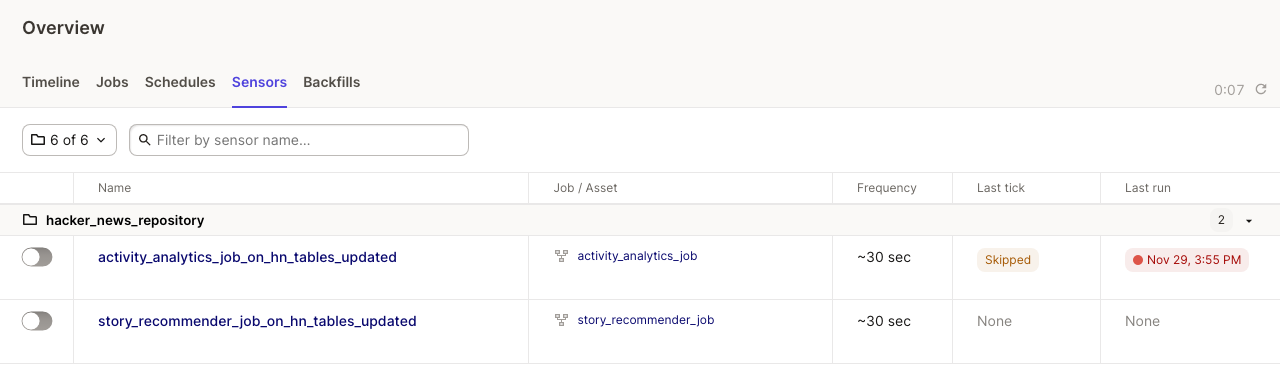
To view all sensors, navigate to Overview > Sensors. Here, you can start and stop sensors, and view their frequency, last tick, and last run:
Click on any sensor to test the sensor, monitor all sensor evaluations on a timeline, and view a table of runs launched by the sensor. See Testing sensors.
Viewing sensor-triggered runs in the timeline
To distinguish sensor-triggered runs from ad-hoc materializations, navigate to Overview > Activity and use the view toggle to switch between display modes. Sensor-triggered runs appear as separate entries from manual launches and from runs initiated by other automation, which makes it easier to track sensor activity in isolation.